ENGLISH
During my presentation at TC2018, I was asked if I could explain how to do one of the visualisation I presented. (link to my presentation)
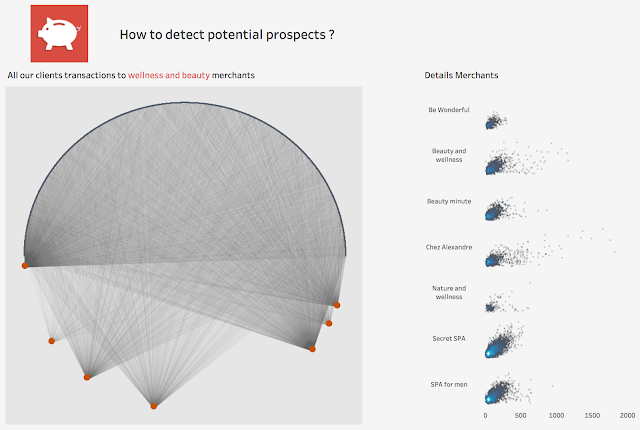
This dashboard show two vizzes :
How to do this chord diagram ( left hand side):
1. As always , the first step is to deal with the data, we need to have a data structure like below. As you see for each transaction between a customer and a merchant you need to have 2 rows ( destination and origin) at the end.

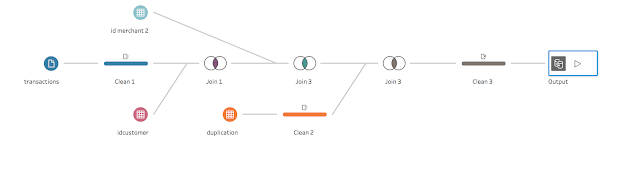
You can either do it in Excel, Tableau or Prep, but the only step is to duplicate the rows. I decided to do it in Prep, but if you want you can do it in Tableau directly.
That the image of my flow in Tableau prep, which also clean the dataset.
If you do it in Tableau Desktop directly you need to have 2 Excel sheets :
- on one Excel sheet your transaction data
- on another Excel sheet you have to type two rows and one column:
Then you do an inner join in Tableau using the join condition 1=1.
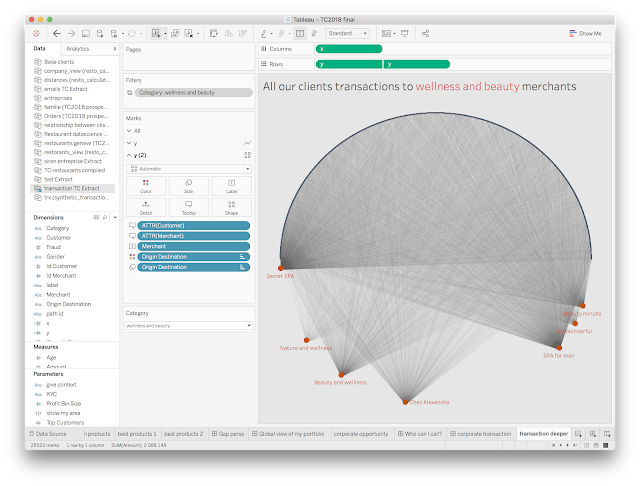
2. Then that we have the data ready, let's build the chart. The chart is nothing more than a circle and some lines, so we will need some trigonometric functions.
For that we need to calculate x and y.
If you remember I wanted all my customers on the top of the circle and all my merchants on the bottom. And my idea is to distribute these customers evenly. On my dataset I have a field called id customer that gives me an unique id for each customer from 1 to the last one. I will use this fied to calculate the position of each customer.
x = cos (angle)
y = sin ( angle)
angle = if [Origin Destination]="origin"
then [angle customer]
else [angle merchant] END
with angle customer being expressed as : PI()*[Id Customer]/({ FIXED : MAX([Id Customer])}+1)
and on a similar way, we can calculate angle merchant -PI()*[Id Merchant]/({ FIXED : MAX([Id Merchant])}+1)
These calculations just divided half of the circle by as many section as necessary to fit all the customers on the top (pi) and all the merchants in the bottom (-pi)

Now we need to draw the lines, representing each transaction between a customer and a merchant.
To do it,
you have to duplicate your y axis by adding another y in rows.
Take a special care about the tooltip to give a meaningful context.
How to do the distribution ( right hand side) ?

This viz is much more easier to build. It represents the distribution for every merchant of their clients by amount of transactions, which allows us to determine how their business is going and if it depends of large or restrict quantity of clients.
Because I duplicate the rows to build the previous visualisation, I have to take care of this duplication in this one. So either you create a calculation in Tableau like
if [Origin Destination]="destination" then [Amount] ELSE 0 END or you fix the datasource.
Then you use this not-duplicated transactions amount into the viz in column and you drag merchant in rows, with customer id in details ( to have a dot by client).
In mark I choose density.
And you obtain this viz.
To be able to distinguish better where the concentration is higher, I added a random field in rows random().
References : you have terrific blog post in internet on trigonometric functions
how to do a radar chart by Jonathan Trajkovic
how to do a radial bar chart by Kevin Flerlage
one of my favourite author and trigonometry vizzard : Ludovic Tavernier
This dashboard show two vizzes :
- On the left hand-side you can see the transactions between banking clients and Wellness and Beauty Merchants ( red dots). So you can visually see which wellness merchants have a lot of clients. On the bottom of the circle you have all the merchants and on the top all the different customer. This is important because it will determine the calculations later.
- The visualisation on the right shows the distribution of these transactions for each merchants by client, allowing to have a big picture of their businesses.

How to do this chord diagram ( left hand side):
1. As always , the first step is to deal with the data, we need to have a data structure like below. As you see for each transaction between a customer and a merchant you need to have 2 rows ( destination and origin) at the end.

You can either do it in Excel, Tableau or Prep, but the only step is to duplicate the rows. I decided to do it in Prep, but if you want you can do it in Tableau directly.
That the image of my flow in Tableau prep, which also clean the dataset.

If you do it in Tableau Desktop directly you need to have 2 Excel sheets :
- on one Excel sheet your transaction data
- on another Excel sheet you have to type two rows and one column:
- origin
- destination
Then you do an inner join in Tableau using the join condition 1=1.
2. Then that we have the data ready, let's build the chart. The chart is nothing more than a circle and some lines, so we will need some trigonometric functions.
For that we need to calculate x and y.
If you remember I wanted all my customers on the top of the circle and all my merchants on the bottom. And my idea is to distribute these customers evenly. On my dataset I have a field called id customer that gives me an unique id for each customer from 1 to the last one. I will use this fied to calculate the position of each customer.
x = cos (angle)
y = sin ( angle)
angle = if [Origin Destination]="origin"
then [angle customer]
else [angle merchant] END
with angle customer being expressed as : PI()*[Id Customer]/({ FIXED : MAX([Id Customer])}+1)
and on a similar way, we can calculate angle merchant -PI()*[Id Merchant]/({ FIXED : MAX([Id Merchant])}+1)
These calculations just divided half of the circle by as many section as necessary to fit all the customers on the top (pi) and all the merchants in the bottom (-pi)
- in rows : x
- in column : y
- in colour : destination origin ( destination in red and origin in black).
- in size : I put also destination origin, because I want to emphasize the merchants
Now we need to draw the lines, representing each transaction between a customer and a merchant.

To do it,
you have to duplicate your y axis by adding another y in rows.
- in path : path id being : STR([Id Customer])+"-"+STR([Id Merchant])
- in details : customer and merchant
- in size : sum of amount to darken a little more the lines
Take a special care about the tooltip to give a meaningful context.
How to do the distribution ( right hand side) ?
This viz is much more easier to build. It represents the distribution for every merchant of their clients by amount of transactions, which allows us to determine how their business is going and if it depends of large or restrict quantity of clients.
Because I duplicate the rows to build the previous visualisation, I have to take care of this duplication in this one. So either you create a calculation in Tableau like
if [Origin Destination]="destination" then [Amount] ELSE 0 END or you fix the datasource.
Then you use this not-duplicated transactions amount into the viz in column and you drag merchant in rows, with customer id in details ( to have a dot by client).
In mark I choose density.
And you obtain this viz.

To be able to distinguish better where the concentration is higher, I added a random field in rows random().
References : you have terrific blog post in internet on trigonometric functions
how to do a radar chart by Jonathan Trajkovic
how to do a radial bar chart by Kevin Flerlage
one of my favourite author and trigonometry vizzard : Ludovic Tavernier